2020 has been a bizarre year for everything—including energy markets. We saw negative oil prices for the first time since the inception of the oil futures contract. Now Henry Hub, a crucial location for spot pricing, reports record low clearing prices. Natural gas has a direct correlation into electricity markets due to the quantity of gas-fired generators in North America. YSG and other market participants will continue to track upcoming market trends in whole power markets. The following information on the topic is courtesy of this article from the U.S. Energy Information Administration (EIA).
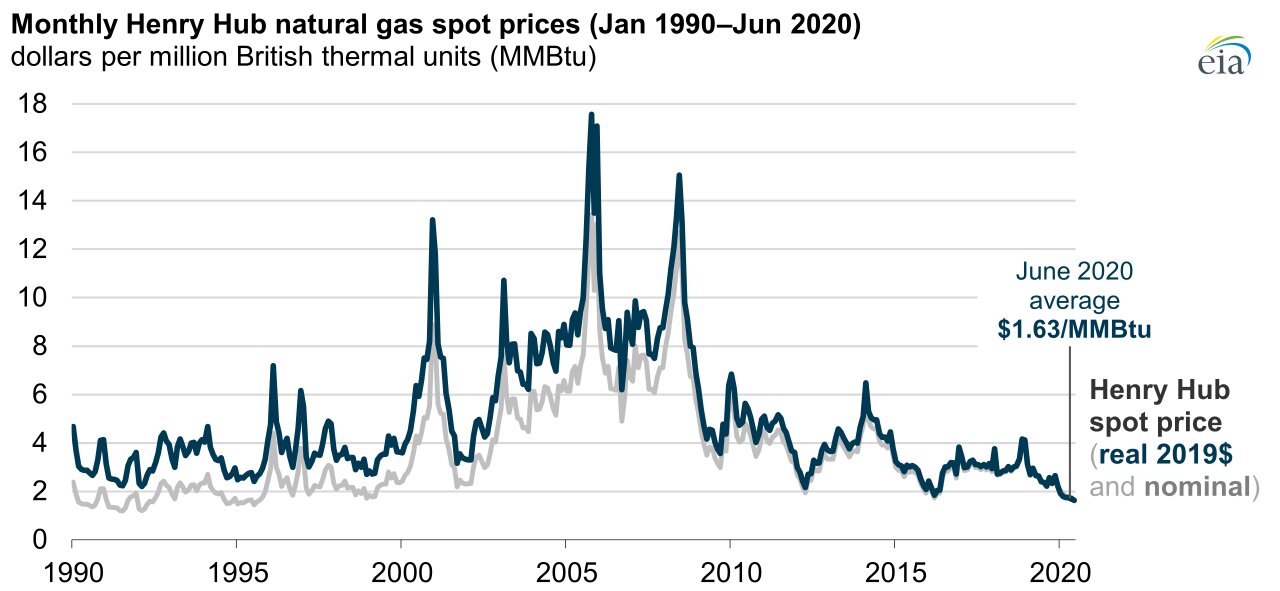
As detailed in the EIA graphic which follows, natural gas prices at the U.S. Henry Hub hit record lows in the first half of 2020. Our recent blog post noted that natural gas was the number one energy generation source in the first half of 2020, and this is certainly due, at least in part, to these record low prices. In terms of figures, 2020 natural gas prices fared as follows:
- First Six Months Average: $1.81 per million British thermal units (MMBtu).
- June Average: $1.63/MMBtu.
It’s understood that the combination of a mild winter to start the year, followed by the economic mitigation necessary due to COVID-19, resulted in lower demand for natural gas throughout 2020, which has led to these low prices. The graphic below shows Henry Hub natural gas prices from January 1990 to June 2020, highlighting the record low average of June 2020.
As noted, a mild winter, with higher temperatures than usual from January through March, contributed to lower demand for natural gas. This also resulted in a higher-than-average amount of natural gas in storage following the traditional heating season (November 1 - March 31). High storage levels suggest that natural gas production is high relative to demand. Additionally, there has been a decline in the export of liquefied natural gas (LNG).
To highlight the declining price of natural gas in 2020, the EIA reports that the monthly average Henry Hub price from February through June of 2020 was less than $2/MMBtu. For comparison, the real Henry Hub price only averaged less than $2/MMBtu in one month prior to 2020, when it fell below $2/MMBtu in March of 2016. Specifically, the daily Henry Hub price reached the record low at $1.38/MMBtu on June 16, 2020. With the exception of California, prices at all major trading hubs were averaging below $2/MMBtu in the first six months of 2020.
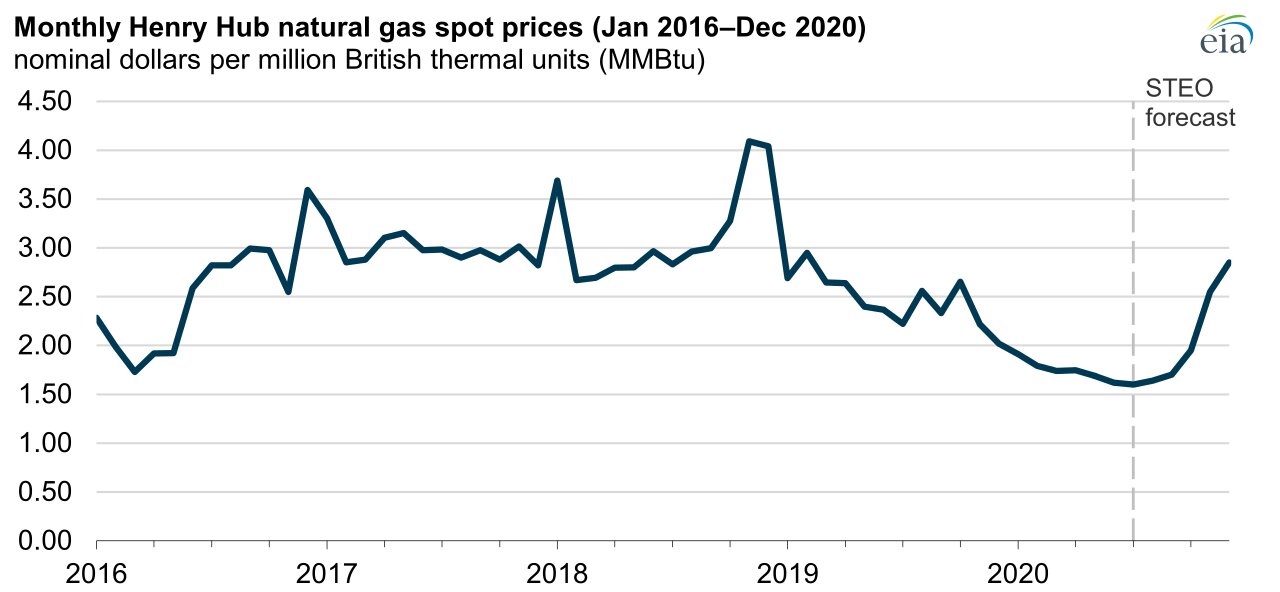
The following chart, again courtesy of the EIA, shows Henry Hub natural gas spot prices between January 2016 and December 2020 (forecasted) in nominal dollars per million British thermal units (MMBtu).
As you can see from the chart above, the Short-Term Energy Outlook (STEO) from the EIA forecasts that Henry Hub natural gas spot prices will increase before the end of the year, averaging at $2.05/MMBtu for the second half of 2020.
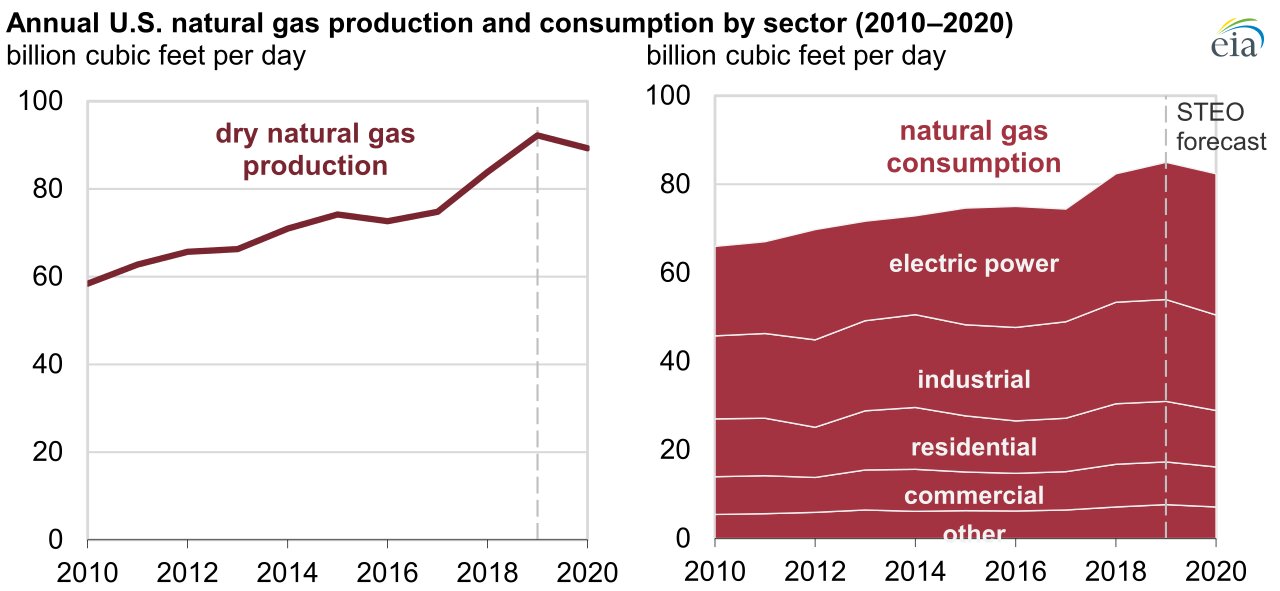
As noted previously, and explored in our recent blog post, natural gas consumption increased in the first half of 2020, compared with the same period in 2019. The next chart, again from EIA, shows annual natural gas production and consumption by sector for the decade from 2010 through to 2020. Again, the remainder of 2020 is forecasted, showing a decline in both consumption and production for natural gas throughout the rest of the year.
To support renewable energy in 2020, and save on your utility bill while doing so, reach out to YSG Solar today. We will discuss your unique energy needs and determine the ideal solar project for your home or business. If you don’t want to install panels on your property, we can find a suitable community solar subscription instead. Send us an email, or call at 212.389.9215 to get started.
YSG Solar is a project development vehicle responsible for commoditizing energy infrastructure projects. We work with long-term owners and operators to provide clean energy assets with stable, predictable cash flows. YSG's market focus is distributed generation and utility-scale projects located within North America.
Sources:

